Plotting vplanet runs
/tmp/ipykernel_5298/1180289843.py:5: DeprecationWarning: `set_matplotlib_formats` is deprecated since IPython 7.23, directly use `matplotlib_inline.backend_inline.set_matplotlib_formats()`
  set_matplotlib_formats('retina')
Overview
Let’s plot the results of the CircumbinaryOrbit example.
[3]:
import vplanet

output = vplanet.run("examples/CircumbinaryOrbit/vpl.in")
Let’s grab the Eccentricity arrays for both planets in the simulation. For more details on this, see the tutorial on get_output.
[4]:
time = output.earth.Time
earth_e = output.earth.Eccentricity
cbp_e = output.cbp.Eccentricity
Behind the scenes, vplot subclasses and overrides matplotlib.figure.Figure, which enables it to automagically format plots containing vplanet quantities. Check it out:
[5]:
import matplotlib.pyplot as plt
import vplot
[6]:
plt.plot(time, earth_e);
plt.plot(time, cbp_e);
WARNING: AstropyDeprecationWarning: support for accessing str attributes such as 'title' from PhysicalType instances is deprecated since 4.3 and will be removed in a subsequent release. [astropy.units.physical]
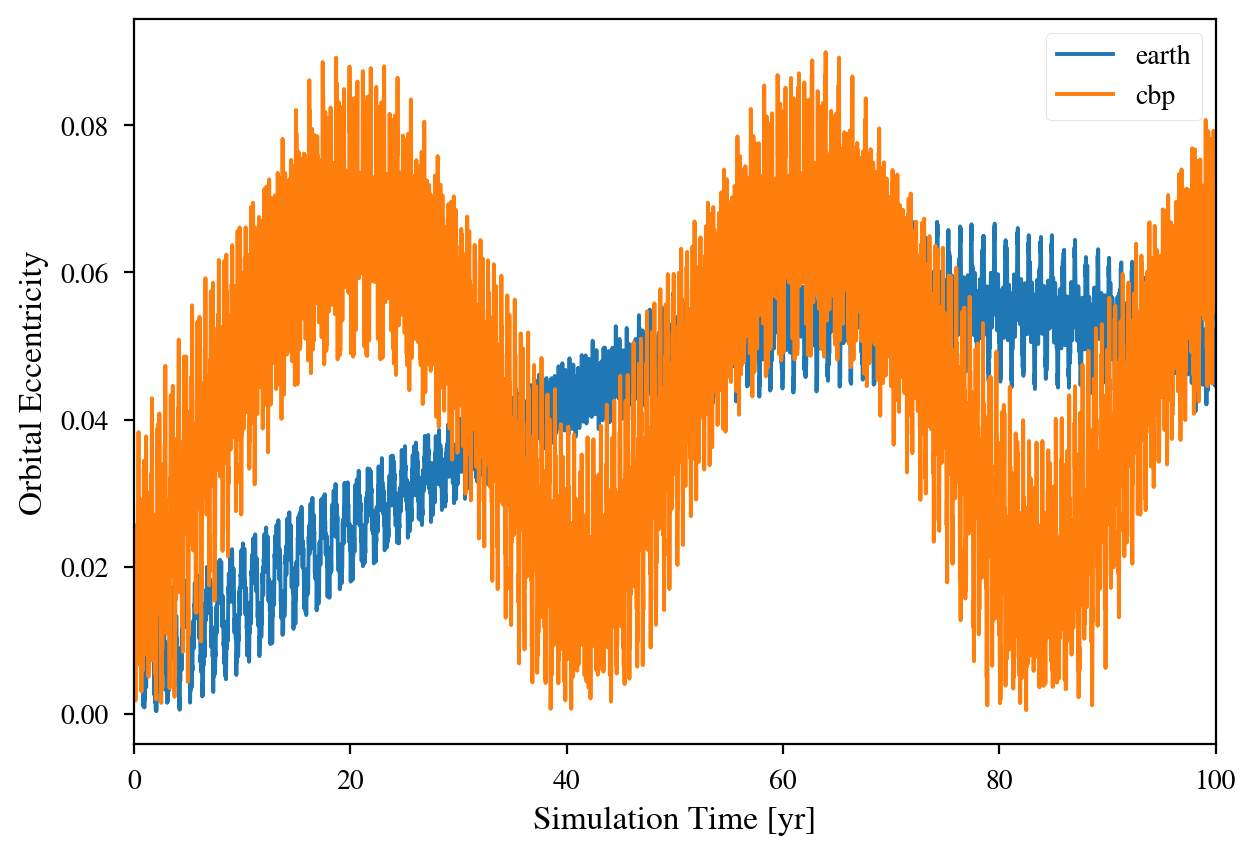
Note how vplot automatically added axes labels and a legend, without any input from the user. There is a lot of functionality built into the plotting in vplot, so make sure to try it out.
Note
More coming soon!