Flare frequency distribution of Proxima Centauri
Overview
This example compares the models of flare frequency distribution proposed by Davenport et. al (2019) and Lacy et. al (1976).
Date |
09/15/21 |
Author |
Laura Amaral |
Modules |
FLARE STELLAR |
Approx. runtime |
5 seconds |
To run this example
python makeplot.py <pdf | png>
Expected output
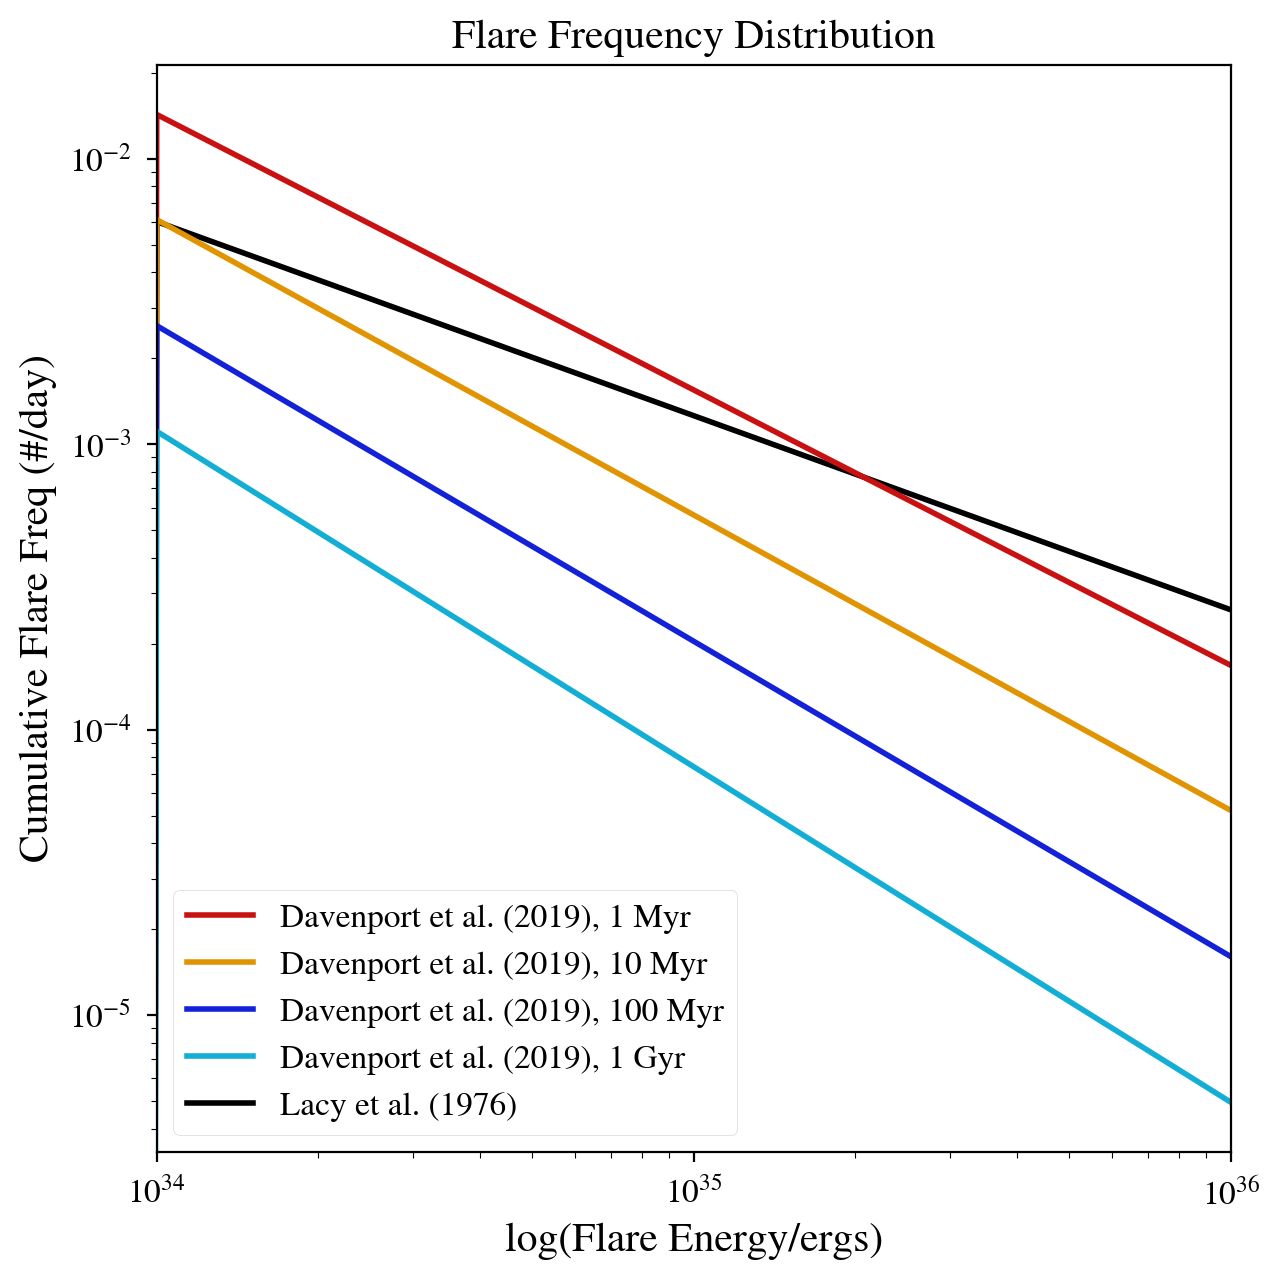
Flare frequency distribution (FFD) for Proxima Centauri between 10^34 and 10^36 ergs. The red, orange, dark blue, and pale blue lines represent the FFD from Davenport et. al (2019) at 1 Myr, 10 Myr, 100 Myr and 1Gyr, respectively. The black line is the Lacy et. al (1976) model, where the FFD is constant for all the stellar ages.