Tidal Heating of Io
Overview
Surface energy flux on Io due to tidal dissipation according to EqTide’s “constant-phase-lag” model.
Date |
07/25/18 |
Author |
Rory Barnes |
Modules |
EqTide |
Approx. runtime |
1 minute |
This example reproduces the surface energy flux on Io over a range of eccentricity and obliquity. It also shows how to use VSPACE, a python that can generate input files across a parameter range. VSPACE will create a large number of directories, each of which has 3 input files. In this example, the makeplot.py script will run each individual trial, gather the results, and create the summary plot below. The orange strip corresponds to the observed heat flow of Io (Veeder et al. 2012).
To run this example
python makeplot.py <pdf | png>
Expected output
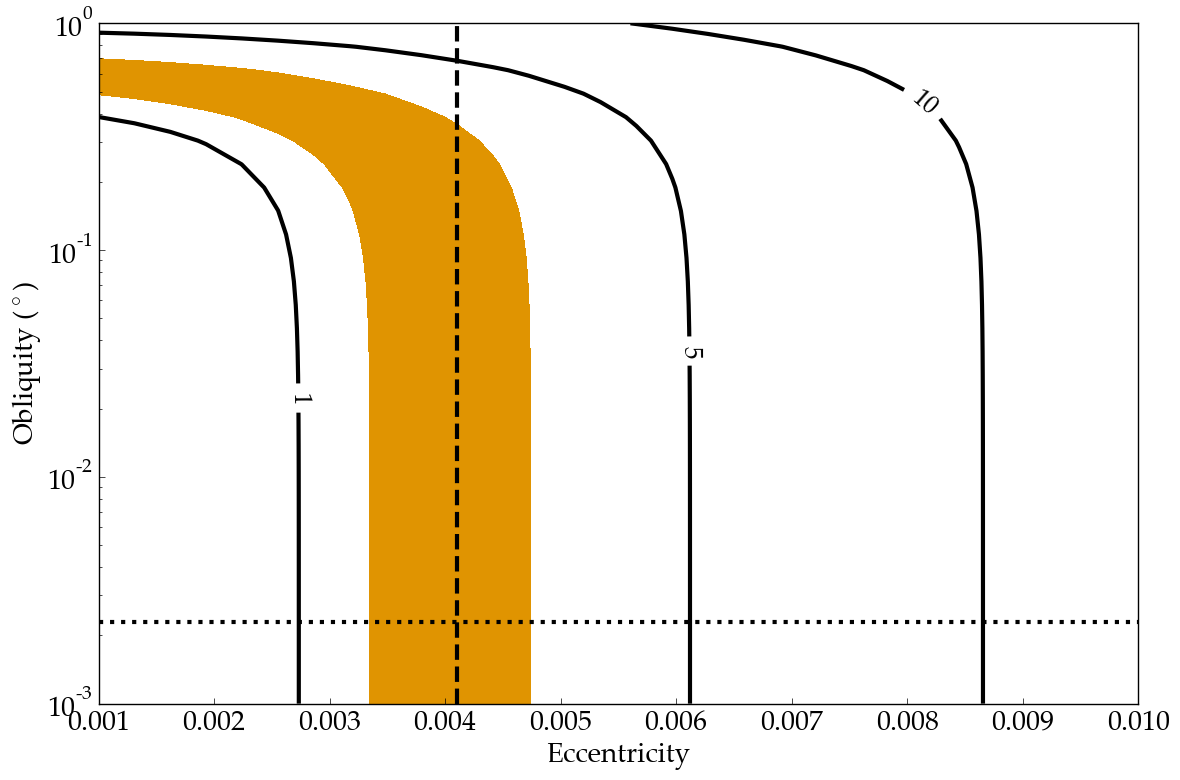
Contour plot of surface tidal heat flux of Io as a function of its eccentricity and obliquity. Contour units are W/m^2, the vertical line corresponds to Io’s observed eccentricity, and the horizontal line is the expected obliquity if Io is in a Cassini state (Bills & Ray 2000). The orange shaded region corresponds to the observed value of 1.5-3 W/m^2 (Veeder et al. 1).