Stellar Magnetic Braking
Overview
Rotational evolution of stars due to magnetic effects.
Date |
06/19/19 |
Author |
David Fleming |
Modules |
STELLAR |
Approx. runtime |
2 minutes |
Updates |
‘24 Aug, Sean Matt |
Rotation period evolution for 0.1 and 1.0 solar-mass stars due to stellar evolution and magnetic braking. This example shows how the four available magnetic braking laws (Reiners & Mohanty [2012], Repetto & Nelemans [2014], Matt et al. [2015], and the “standard model” of Breimann et al. [2021]) impact the rotation period.
This example also demonstrates how the VPLanet implementation of the Matt et al. [2015] magnetic braking model can be used to reproduce the upper enveloped of the Kepler field stellar rotation period distribution, a main result from Matt et al. [2015].
To run this example
python makeplot.py
Expected output
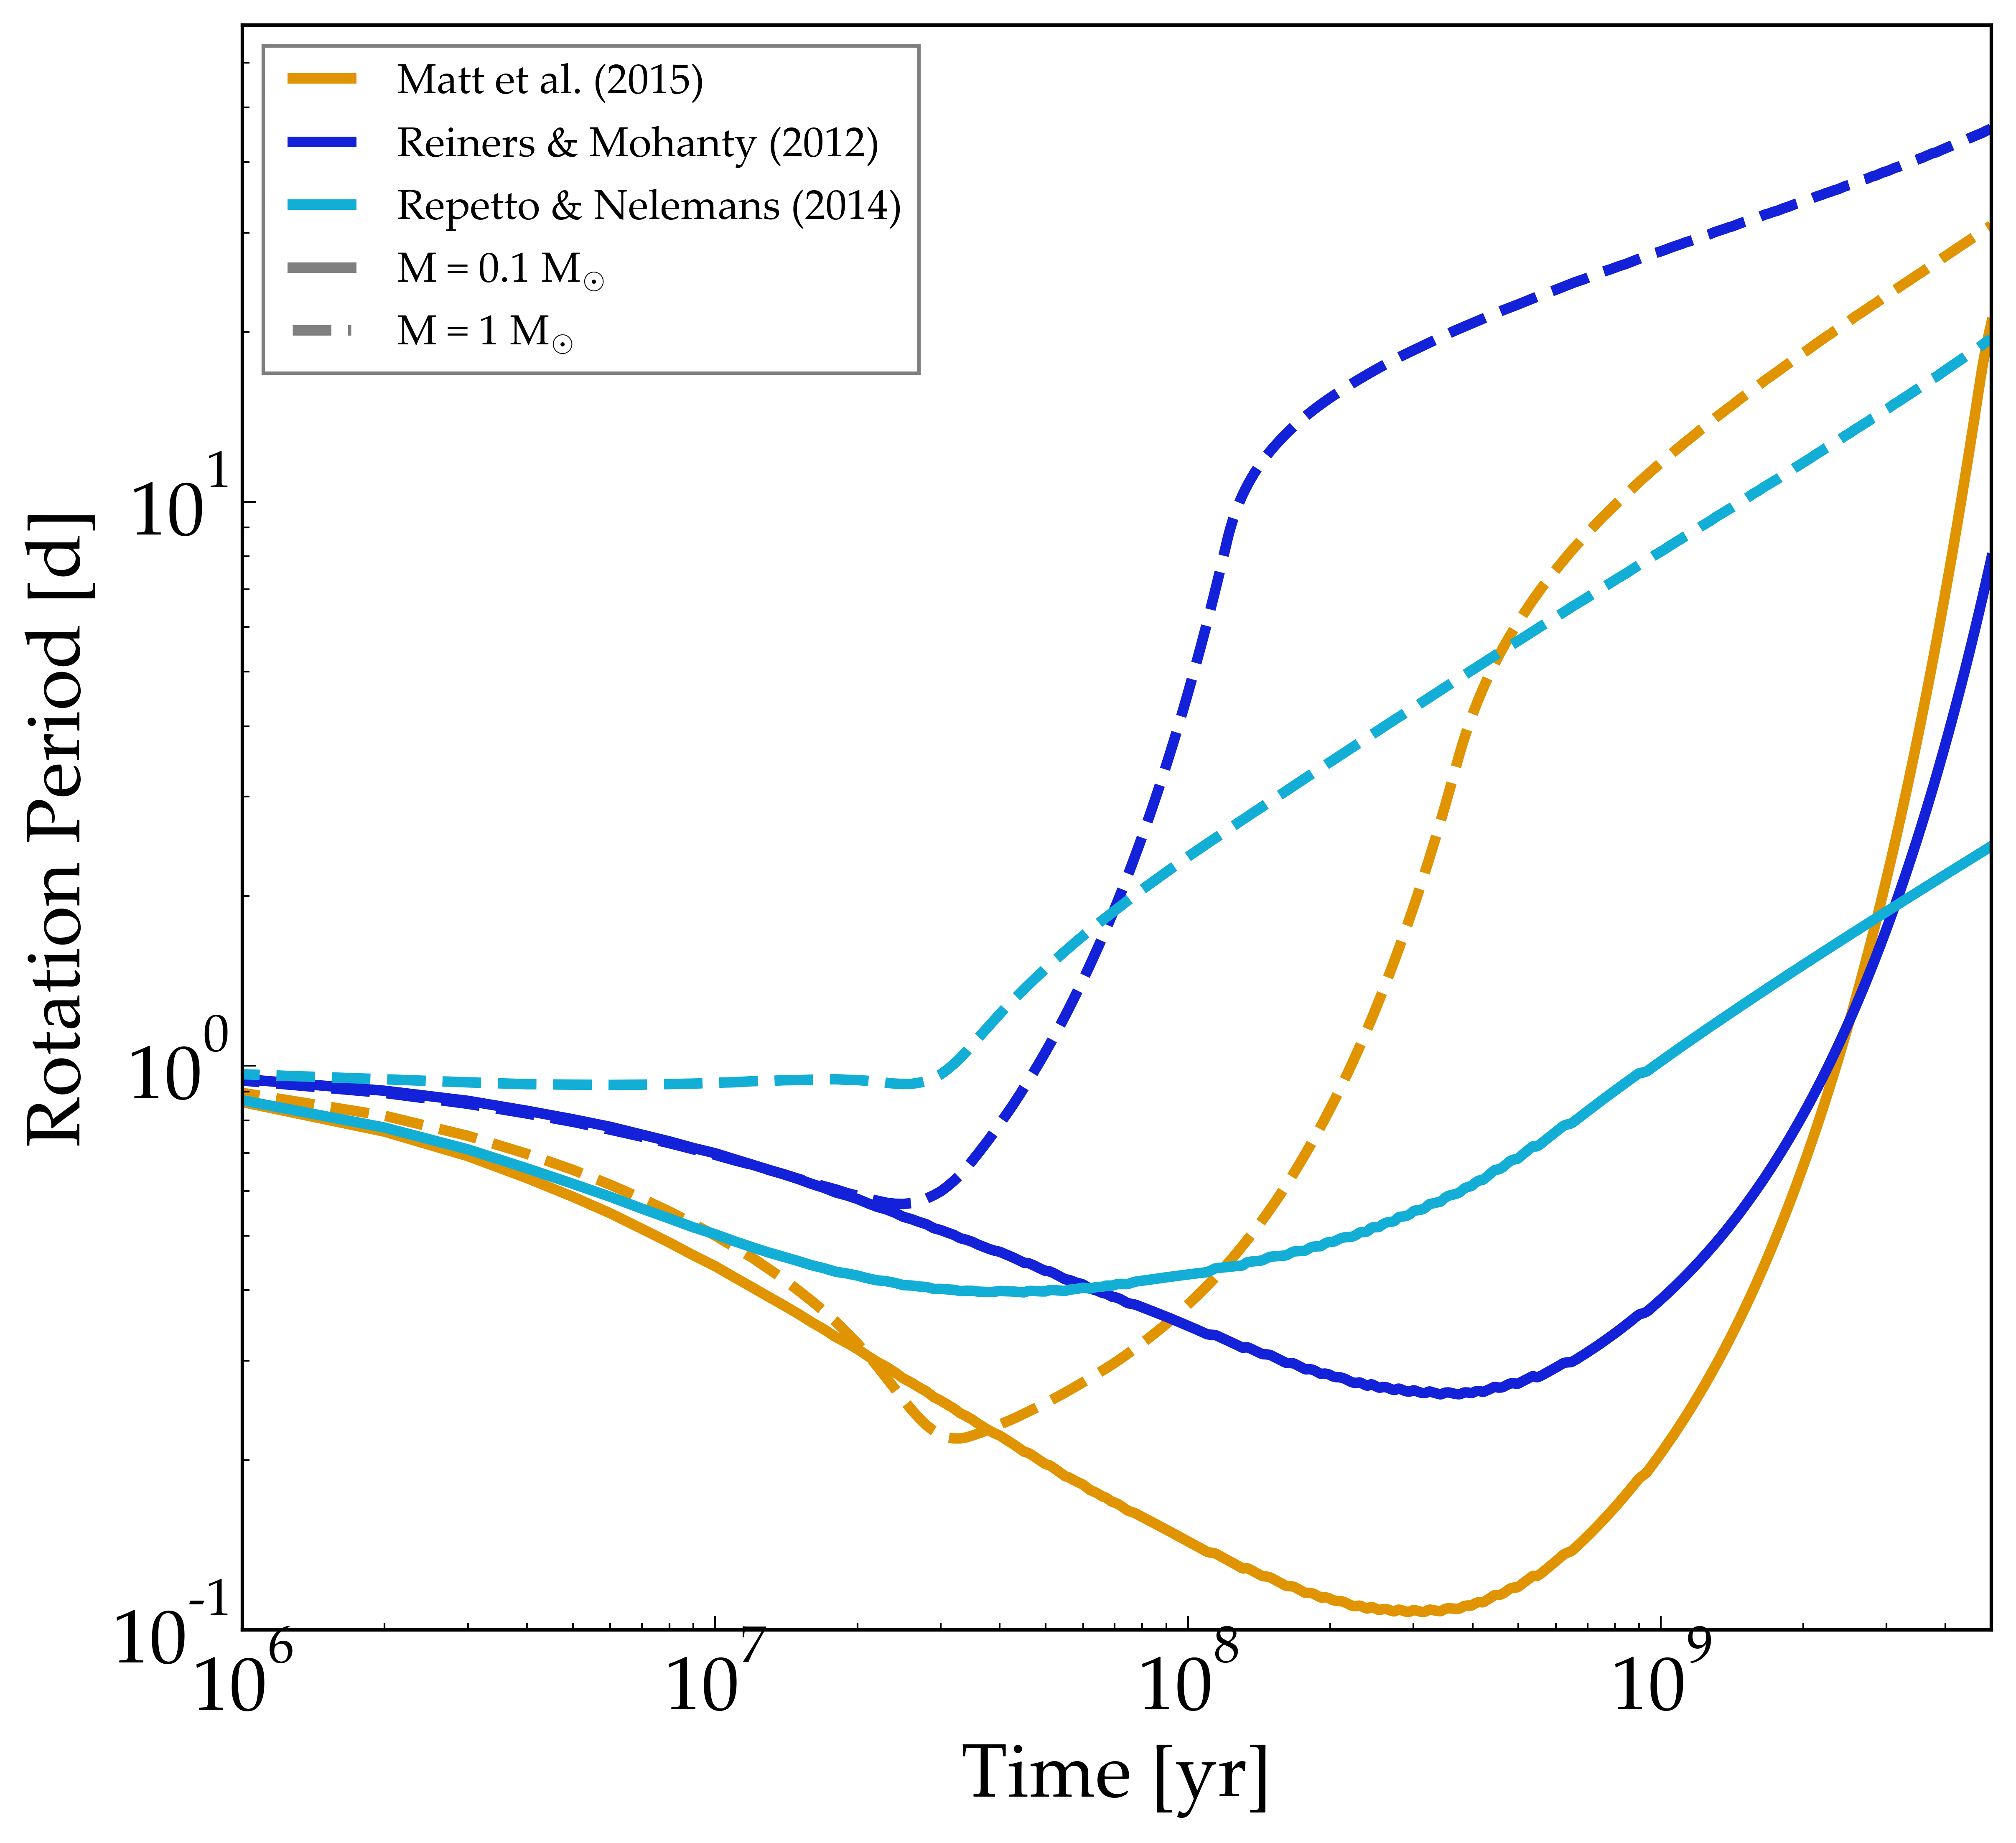
Rotation period evolution of 0.1 and 1 solar-mass stars, due to structural evolution (Baraffe et al. 2015) and the four magnetic braking laws.
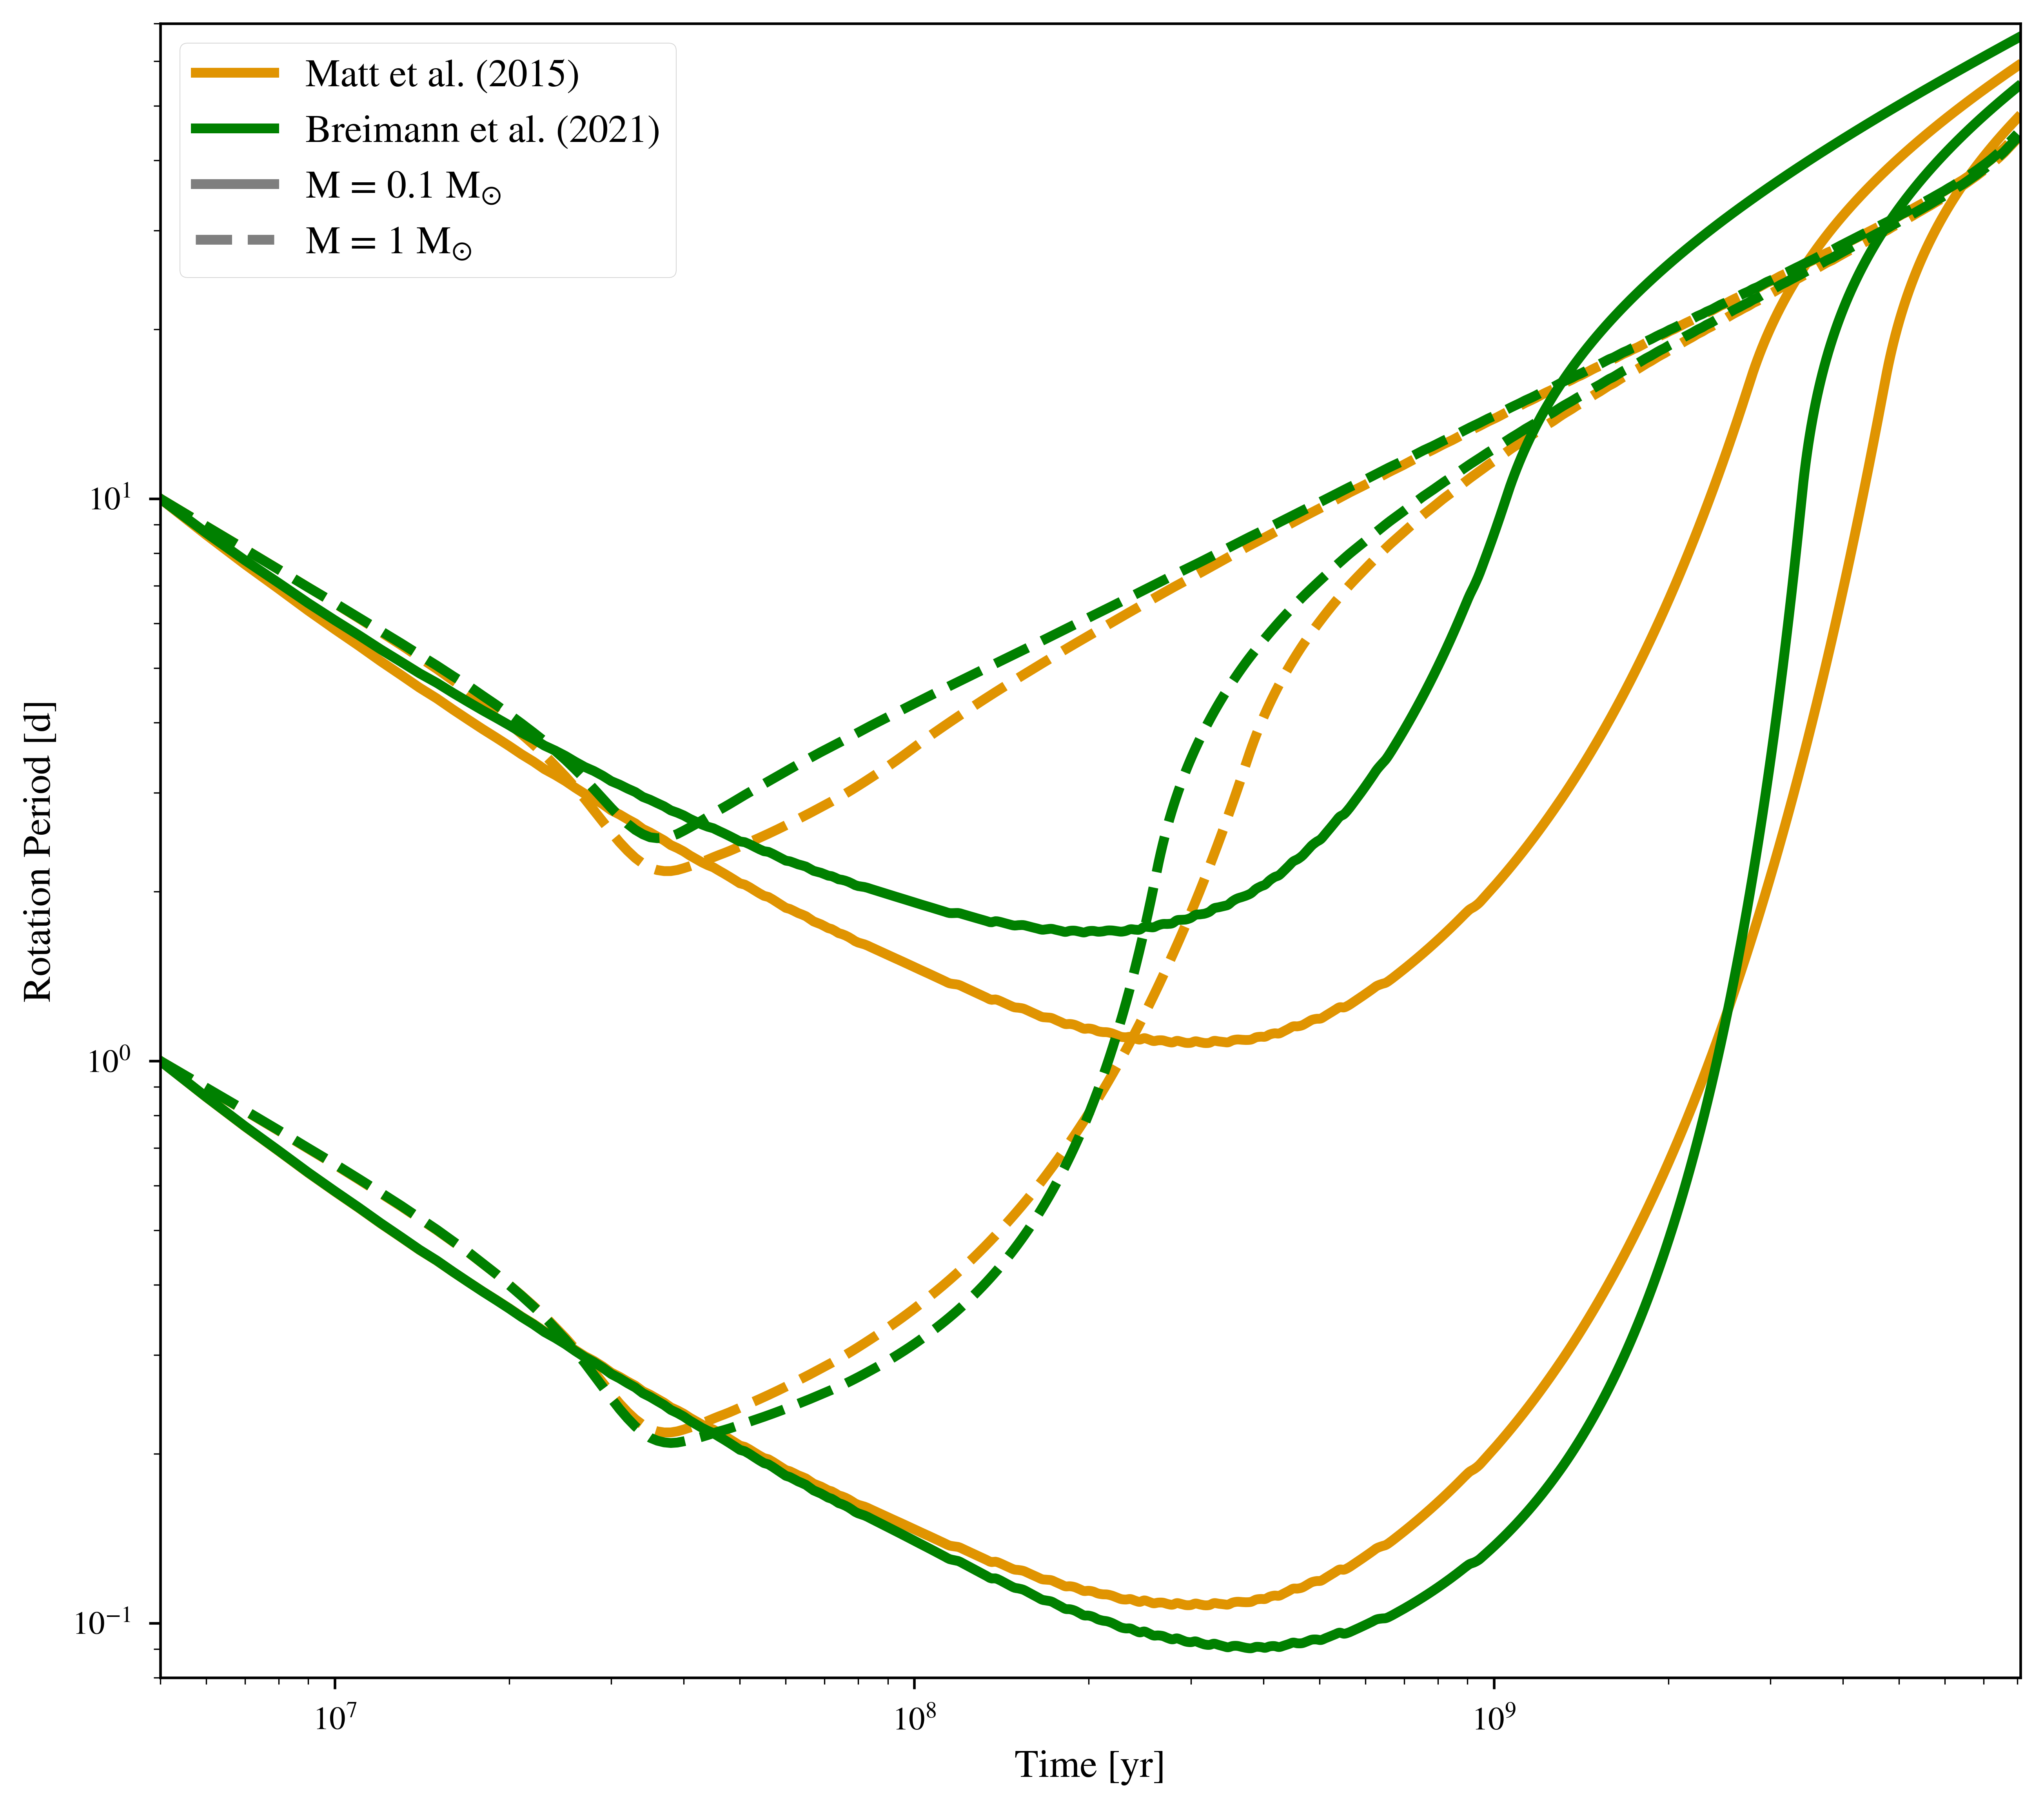
Rotation period evolution of 0.1 and 1 solar-mass stars due to structural evolution (Baraffe et al. 2015) and the two more modern magnetic braking laws, for two different initial rotation rates.

Stellar wind torque versus Rossby number of 0.1 and 1 solar-mass stars during their evolution (Baraffe et al. 2015), comparing two magnetic braking laws (approximately following fig. 10 in Breimann et al. 2021, but here for different masses and here including the effects stellar structural evolution).
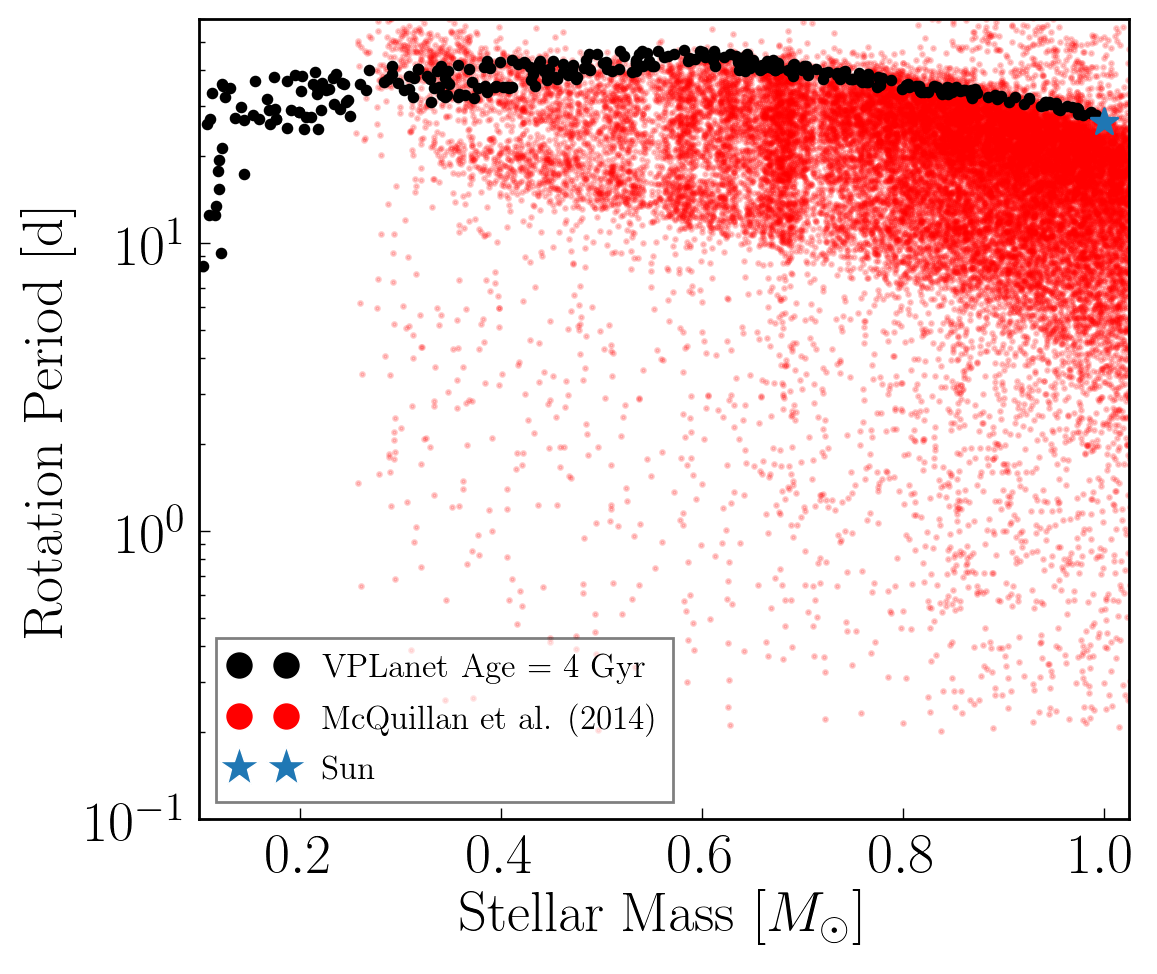
Rotation period distribution of a ~4 Gyr-old synthetic cluster of stars simulated using STELLAR with the Matt et al. [2015] magnetic braking model (black, adapting VPLanet simulations from Fleming et al. [2019]). Following Fig. (3) in Matt et al. [2015], we compare the Fleming et al. [2019] simulated distribution to the rotation distribution of Kepler field stars (red) measured by McQuillan et al. [2014]. For reference, we plot the modern solar rotation period as a blue star. Using STELLAR, Fleming et al. [2019] recover the Matt et al. [2015] result that the upper envelope of the Kepler stellar rotation period distribution is well-matched by a 4 Gyr-old synthetic cluster, validating the STELLAR implementation of the Matt et al. [2015] magnetic braking model.